

About Super Heart Rate Monitor
The Super Heart Rate Monitor application takes the heart rate measurement feature of your watch to a new level.
You can use the app for both simple and complex measurements - from short time uses to tracking your heart rate while sleeping.
Features:
• Heart rate measurements with advanced graphs
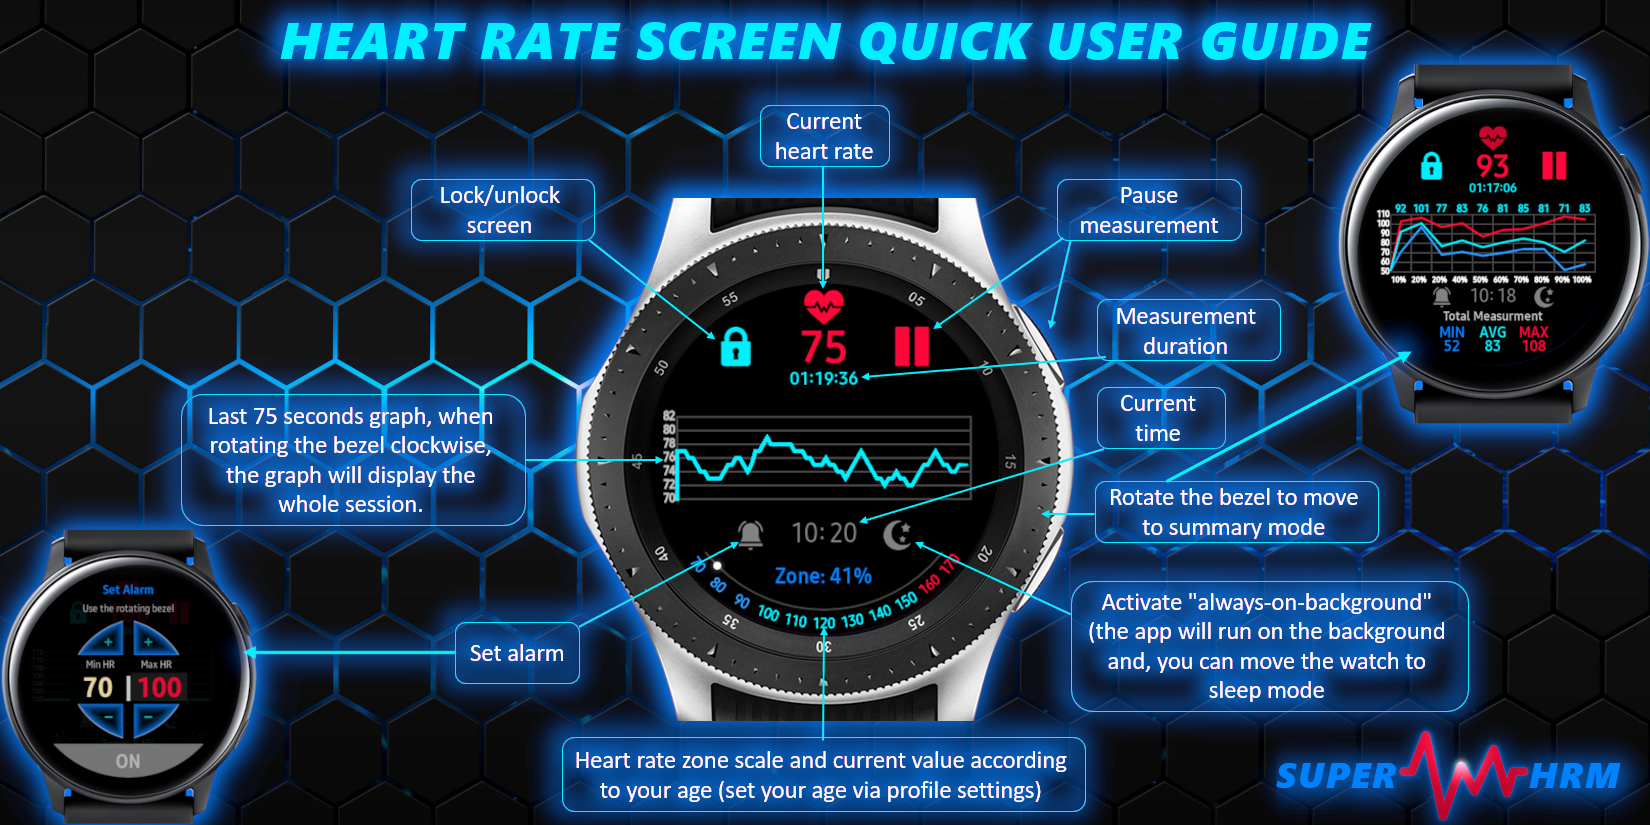
• Display your current heart rate zone according to your physical profile (great for sports workouts)
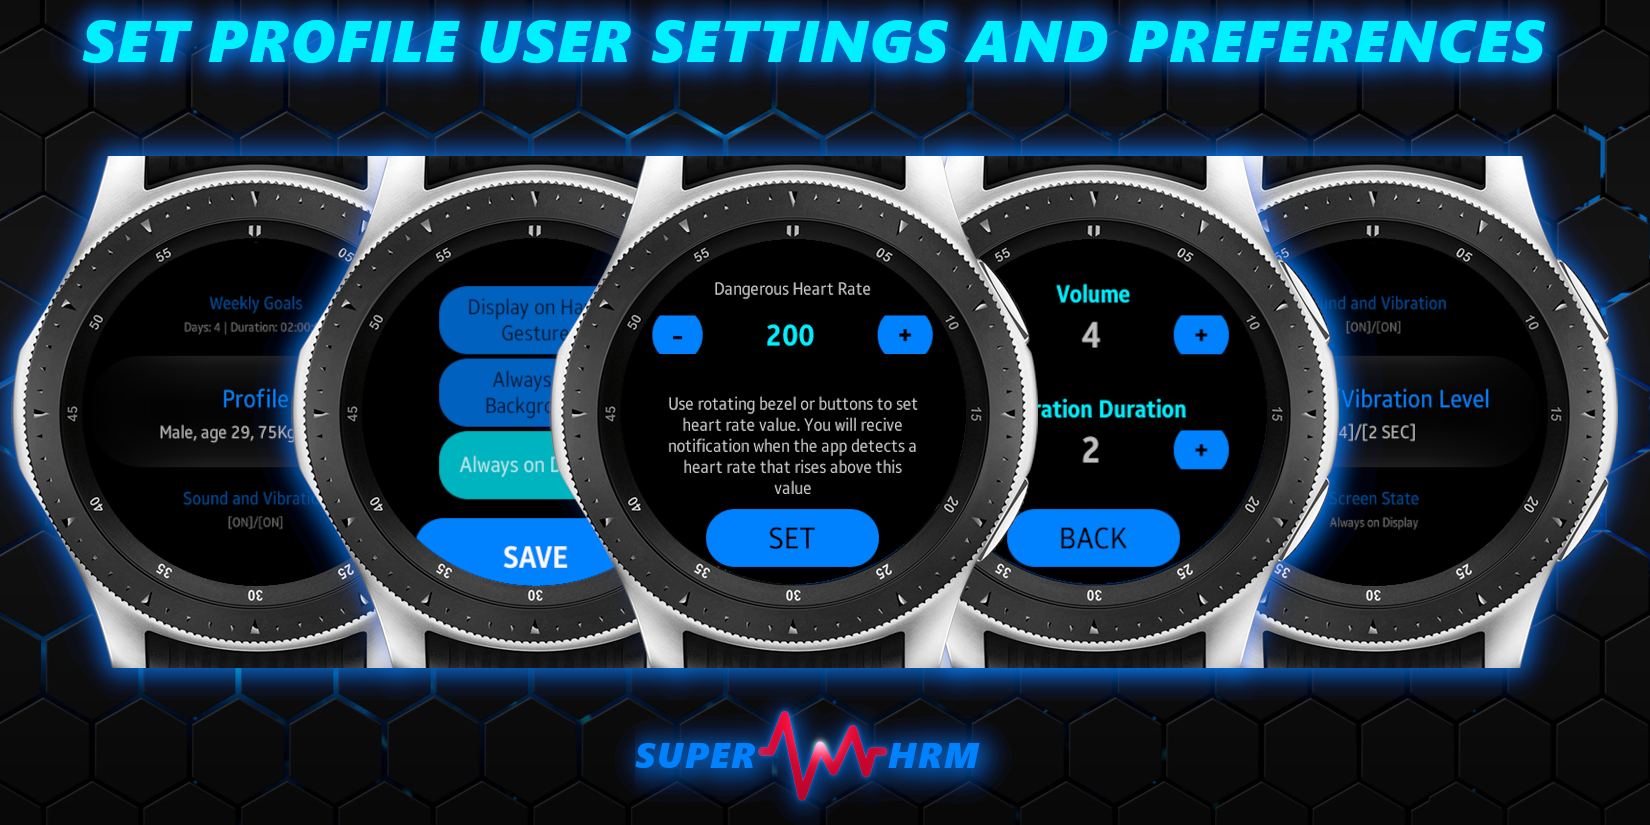
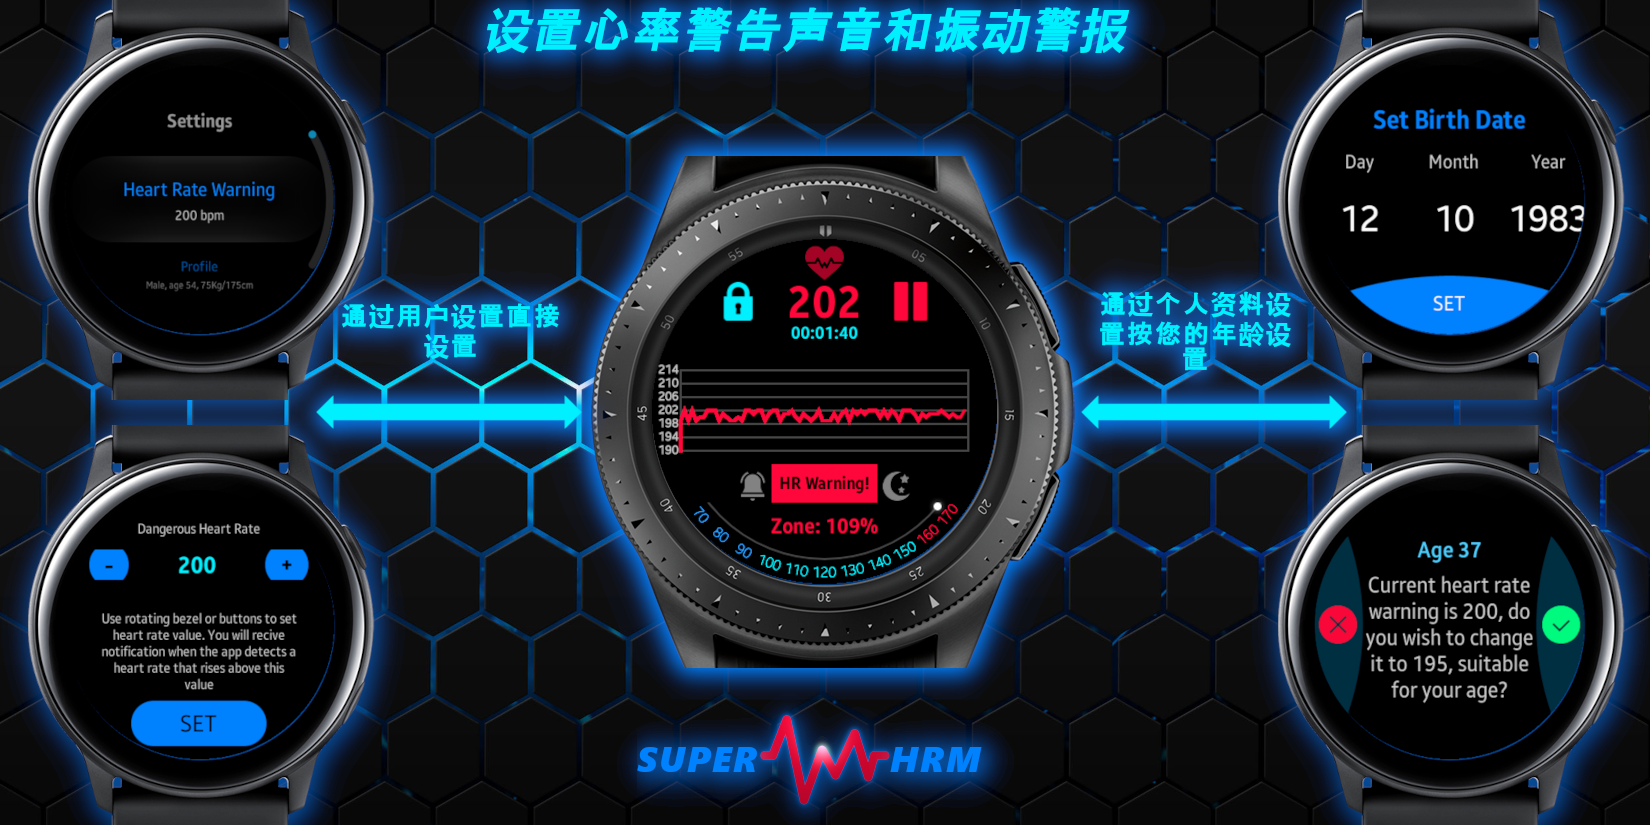
• Set up your physical profile (gender, age, height, and weight) for maximum accuracy of the application
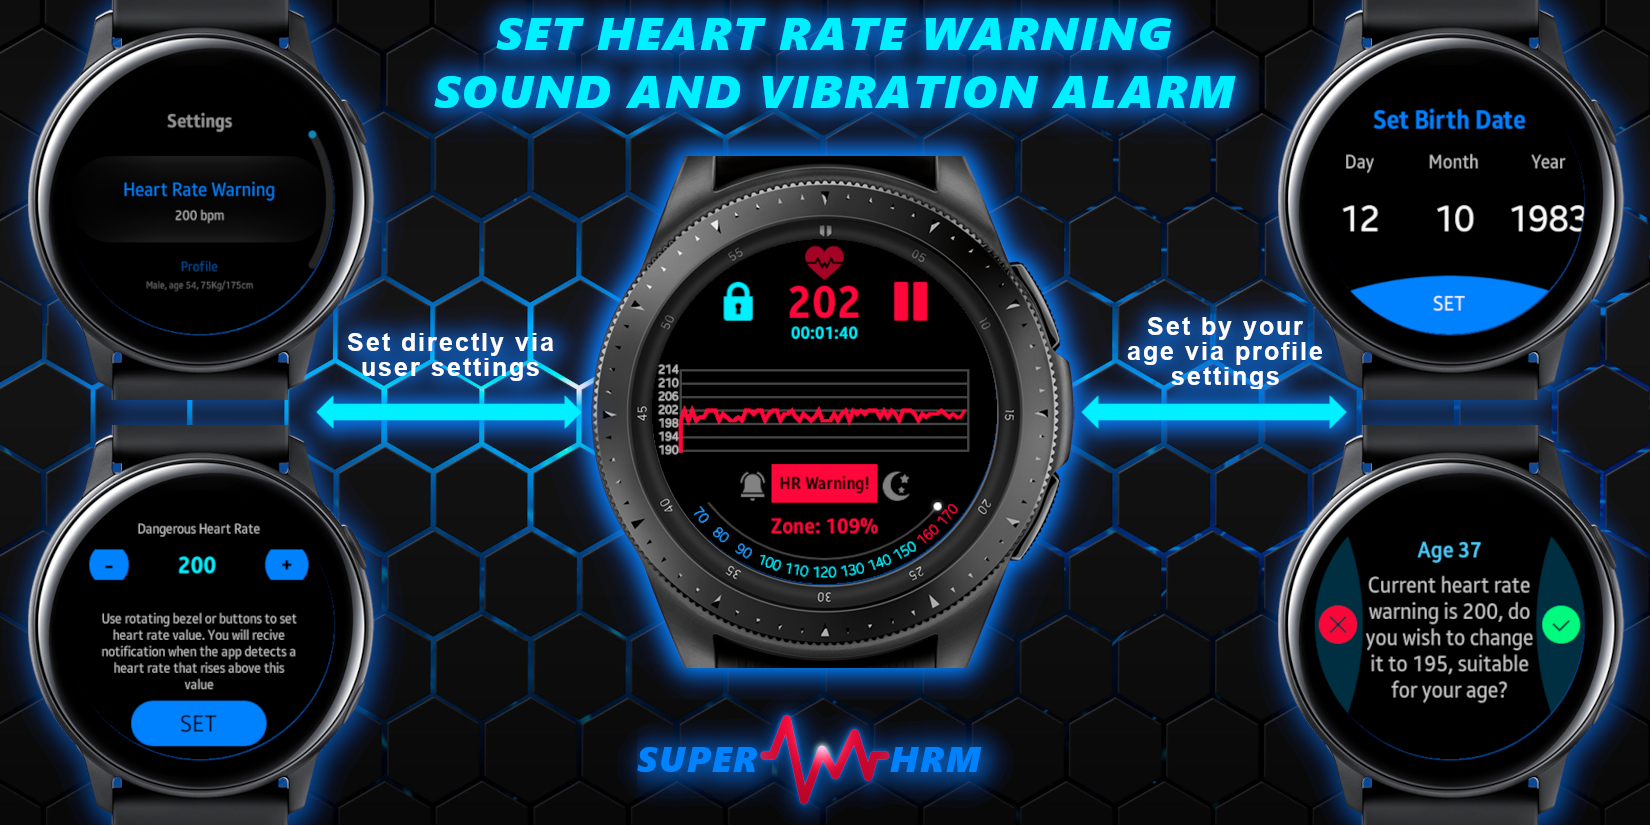
• Get notification when the heart rate rises above the value you defined in your settings, or based on your physical profile
• Detailed descriptive statistics analysis (min, max, avg, and standard deviation)
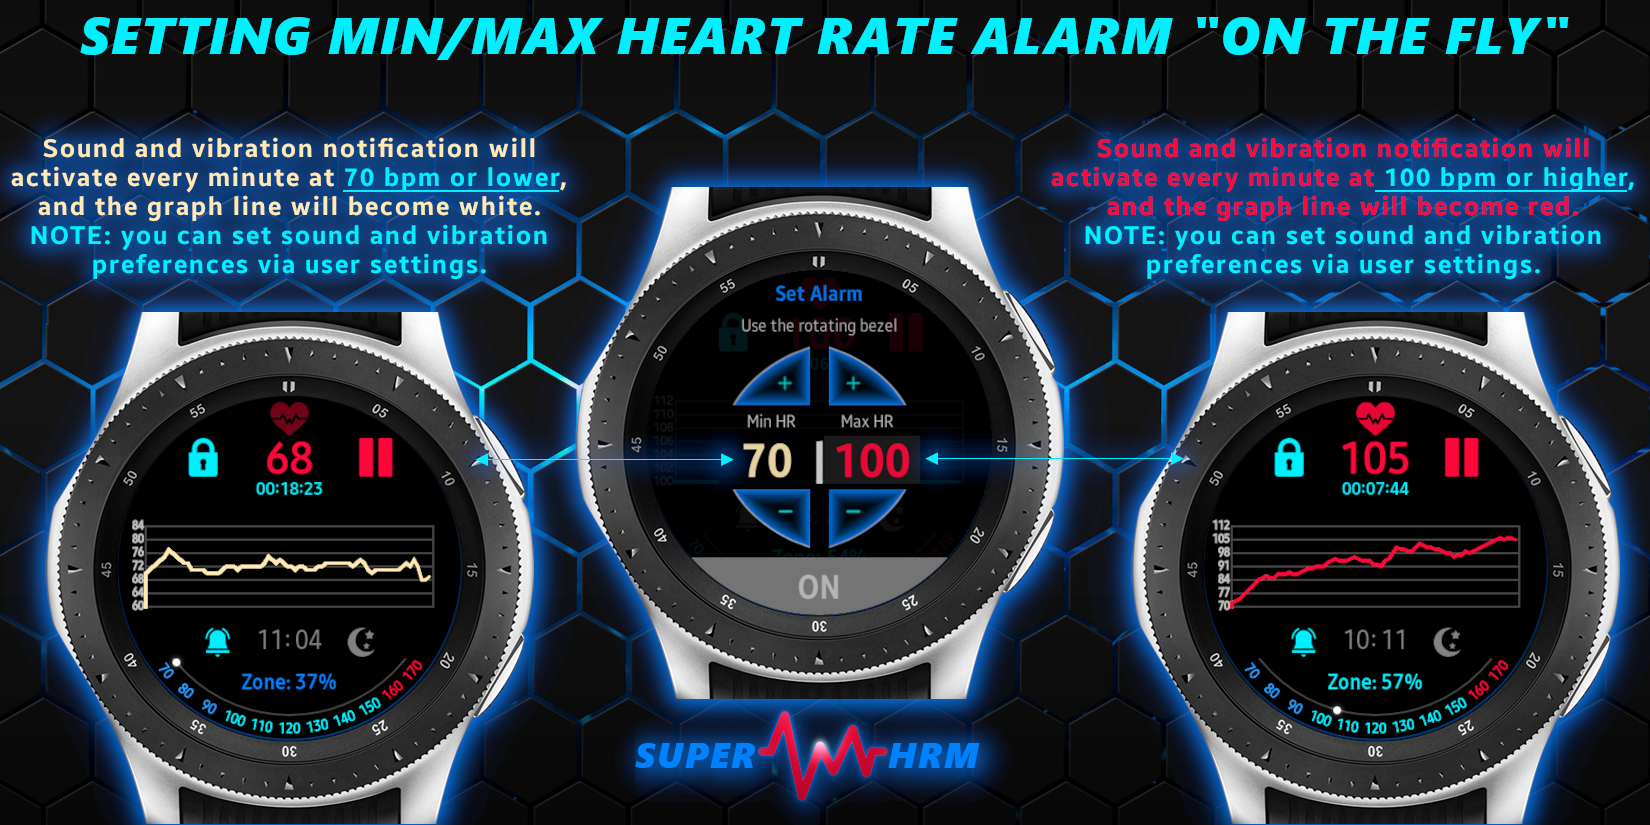
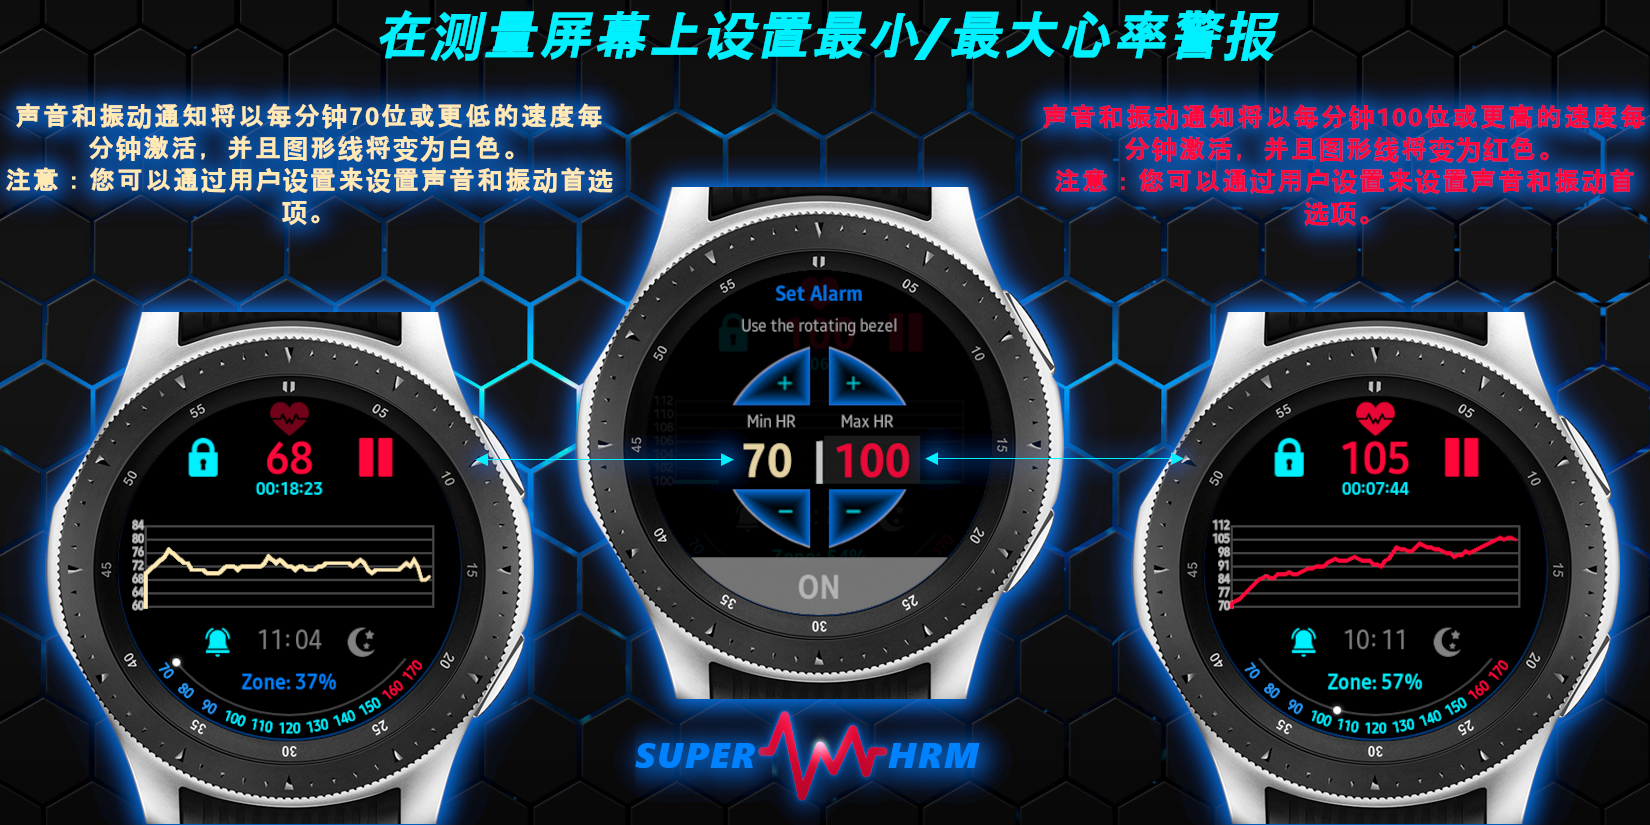
• Set sound and vibration alarm for minimum and maximum heart rates
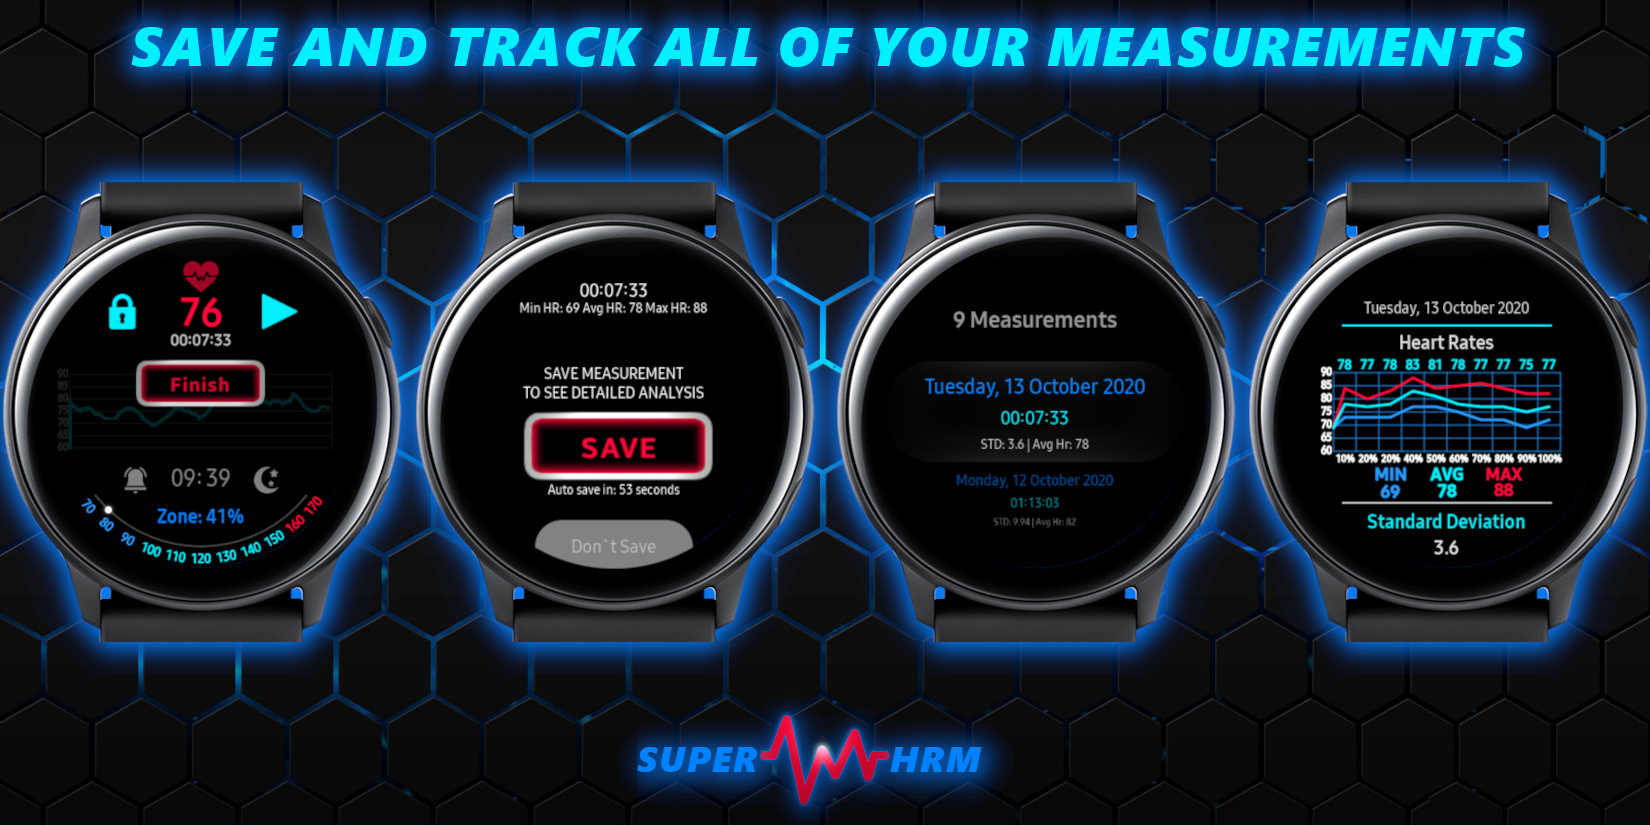
• Save all of your measurements
• Detailed activity log
• advanced customization settings
• Set your screen state (as default via user settings or on the run while measuring).
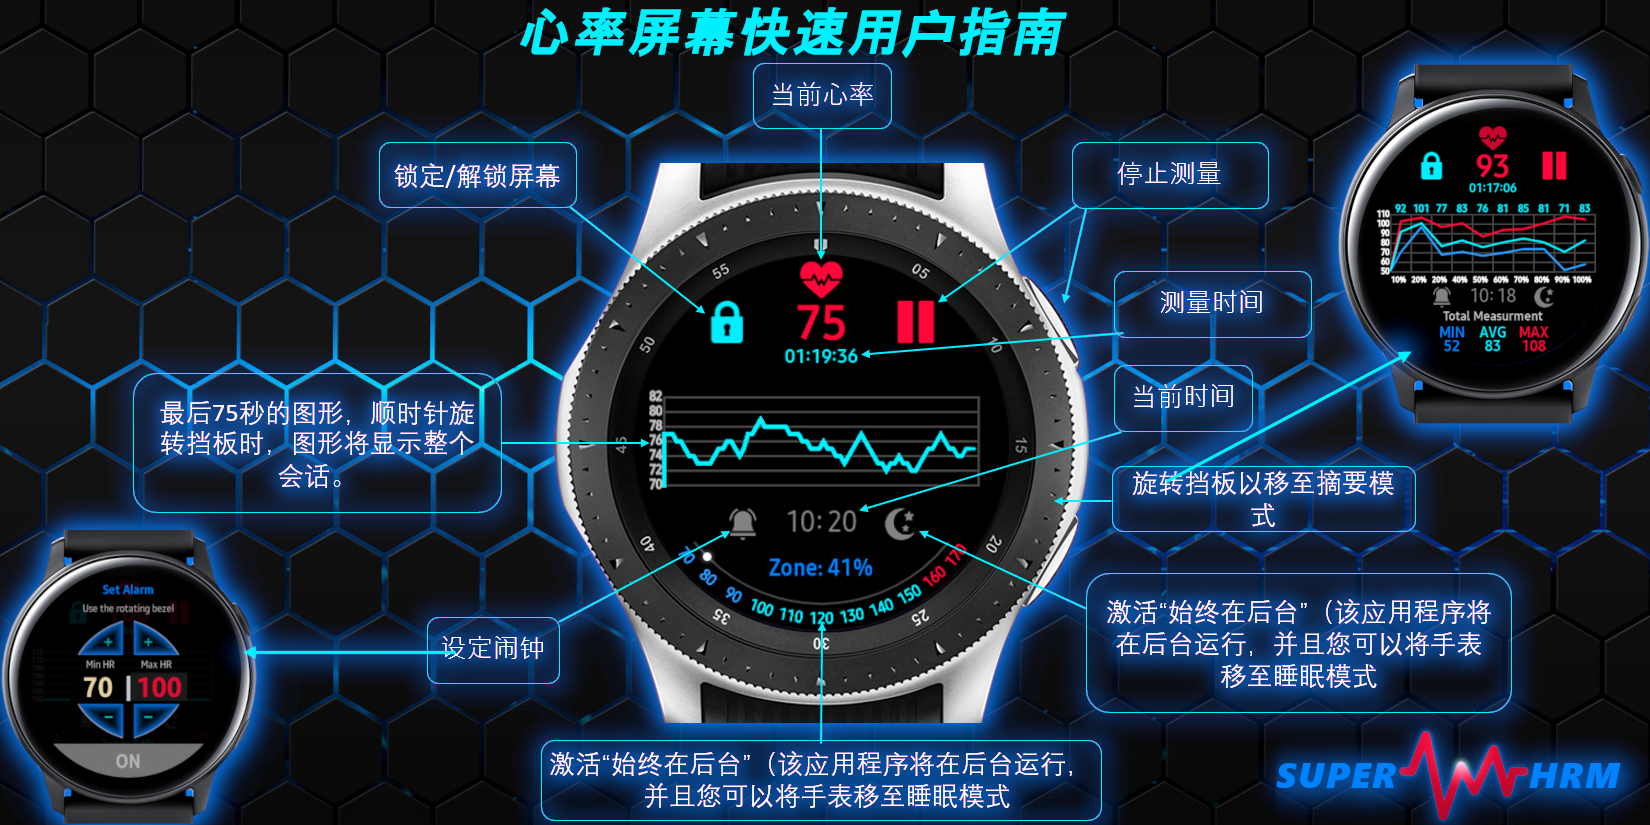
Screen states:
1. Always-on display: The application will always be in the foreground and even on hand moving gestures (default state).
2. Display-on Hand Gesture: The application will move to the foreground when a wrist up hand gesture has been made.
3. Always on Background: This state is used for long-term measurement, and also adapted for the watch sleep mode.
After a few seconds (depends on the watch settings), a hand gesture will not display the application.
The app will run in the background and will move to the foreground when the alarm is off, or when you open the app.
Demo of the App in Action
Application Images and Quick Guides
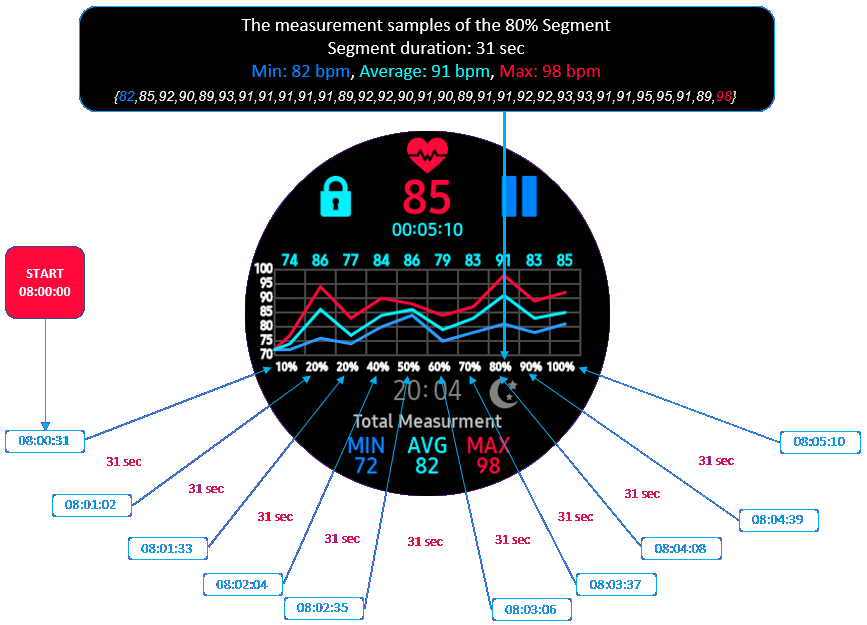
How to read the summary graphs
The total measurement duration is divided into ten equal segments (10%,20%,30%...100%), providing you with a comprehensive and easy-to-understand analysis of your heart rate over time.
The ten segments are divided equally from the beginning of the measurement to the current time.
Each one of the ten segments points is plotted with three types of aggregations:
- MAX: the maximum heart rate of all the values in the segment (in red).
- MIN: the minimum heart rate of all the values in the segment (in blue).
- AVG: the average heart rate of all the values in the segment (in cyan greenish-blue).
For example, let's take a look at the image below.
The measurement started at 08:00:00, and the current time point is 08:05:10,
summing to a total duration of 310 seconds (five minutes and ten seconds).
Therefore, each segment will display data aggregation of 31 seconds (310 seconds /10 = 31 seconds).
The app records a heart rate value every second. It means that in our example each segment has 31 data points.
To better understand this, let's focus on the 80% segment.
The app recorded 31 samples between 08:03:37 and 08:04:08 as follows:
{82,85,92,90,89,93,91,91,91,91,91,89,92,92,90,91,90,89,91,91,92,92,93,93,91,91,95,95,91,89,98}
MAX: the maximum of the series is 98 (marked in red).
MIN: the minimum of the series is 82 (marked in blue).
AVG: the average of the series is 91 (marked in cyan) and written on the top x-axis.
Image of the summary graph: measurement of 5 minutes and ten seconds divided into 10 segments of 31 seconds.
Every second, the application recalculates all segments.
As time elapses, the segments'
length gets longer and records more data points.
After the measurement ends, the summary graph will be displayed and saved for the total measurement time.
Android Smartphone Companion App
About the Companion App
This application is a companion app to the main application of the Samsung galaxy/active smartwatch.
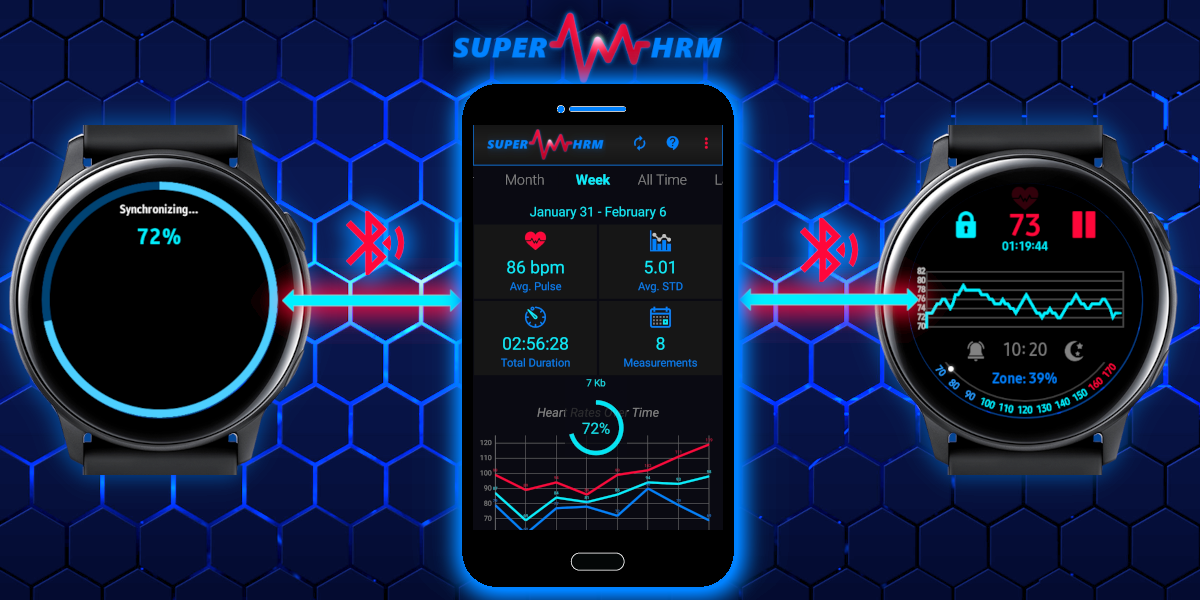
The companion app was created for receiving all the heart rate measurements data from the watch and allows you to view, analyze, save backups to .csv files, generate Excel spreadsheet reports, and share your data with others.
The phone and the smartwatch applications are sharing data using Bluetooth. Before using, make sure that the Bluetooth is active and paired on both devices.
How to Sync Your Watch to Your Phone
You can proactively sync the measurements stored on your watch to your phone whenever you want.
To synchronize the watch with the phone, make sure that the smartphone companion app is activated.
After each synchronization from the watch to the phone, all data that was previously existed is overwritten and replaced by the new data that will be displayed within all the charts, data tables, and the measurements list explorer.
A .csv backup file is created and saved to the phone file system in each sync, So that you will always have the information from any period.
Here are the simple steps to perform the synchronization operation:
- Launch Super HRM app (watch) and the Super HRM companion app (phone).
[Image A] - On the main screen of the watch app click 'settings'.
[Image A] - On the settings screen of the watch app scroll to 'Sync to Phone' and click to open the synchronization screen.
[Image B] - After the synchronization screen loads the app will automatically connect to the phone and the companion app via bluetooth.
[Image C] - After the watch and the phone are connected both devices will prompt that they are connected and a 'Sync to Phone' button will be displayed on the watch.
[Image D] - Press the 'Sync to Phone' button and the synchronization proccess will begin and a progress bar with the transfer progress will be displayed.
[Image E]
Also, Since synchronization is not something that happens often we intentionally built it by requiring a running app and not a service that works all the time in the background since we did not want to burden the phone with unnecessary processes that will listen in the background all the time and impact the user experience of the phone.
Image A
1. Launch Super HRM app (watch) and the Super HRM companion app (phone).2. On the main screen of the watch app click 'settings'.
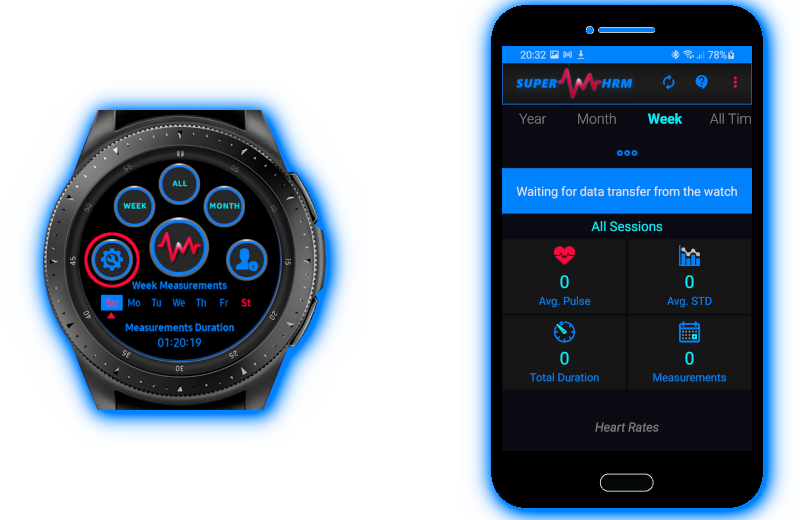
Image B
3. On the settings screen of the watch app scroll to 'Sync to Phone' and click to open the synchronization screen.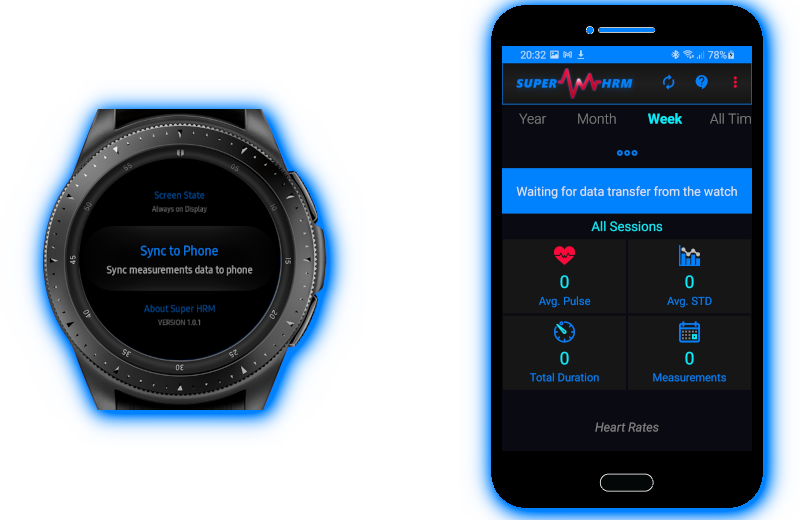
Image C
4. After the synchronization screen loads the app will automatically connect to the phone and the companion app via bluetooth.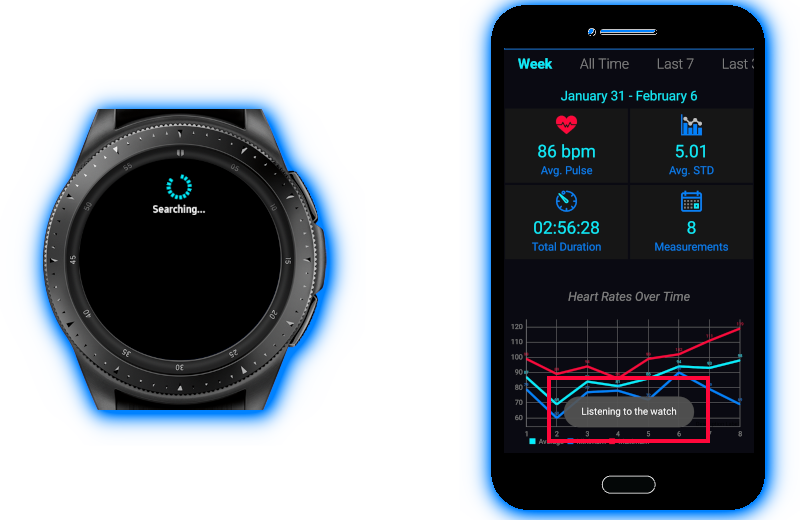
Image D
5. After the watch and the phone are connected both devices will prompt that they are connected and a 'Sync to Phone' button will be displayed on the watch.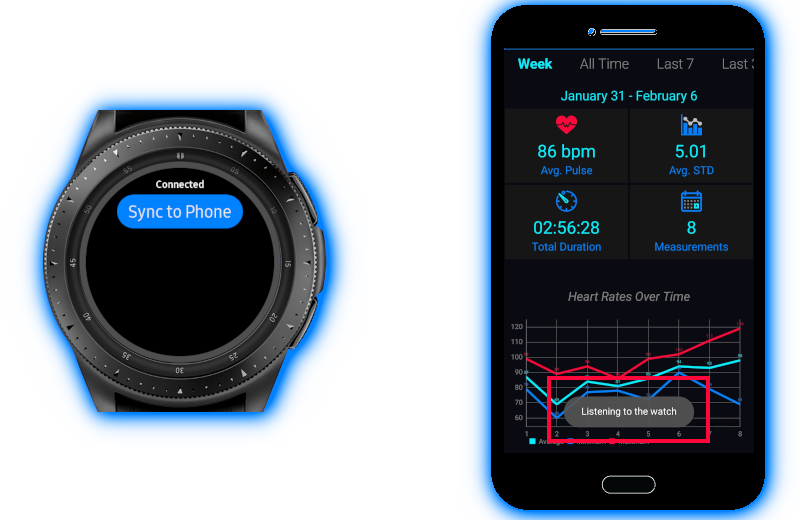
Image E
6. Press the 'Sync to Phone' button and the synchronization proccess will begin and a progress bar with the transfer progress will be displayed.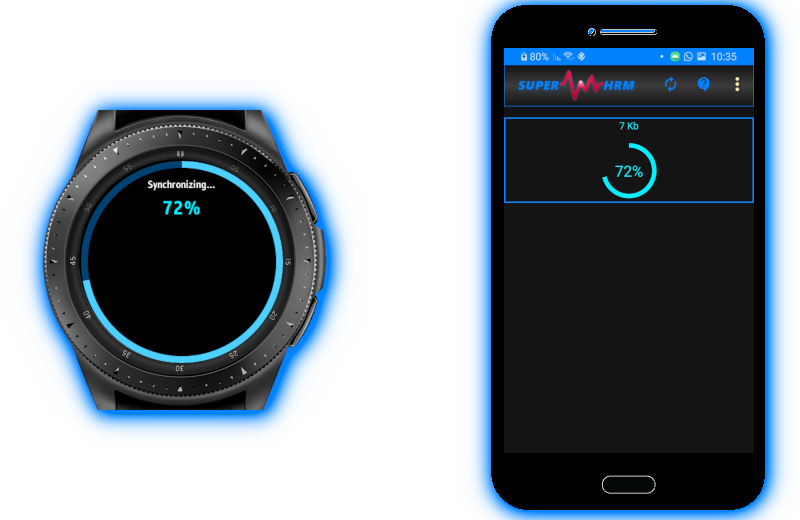
Screens Overview
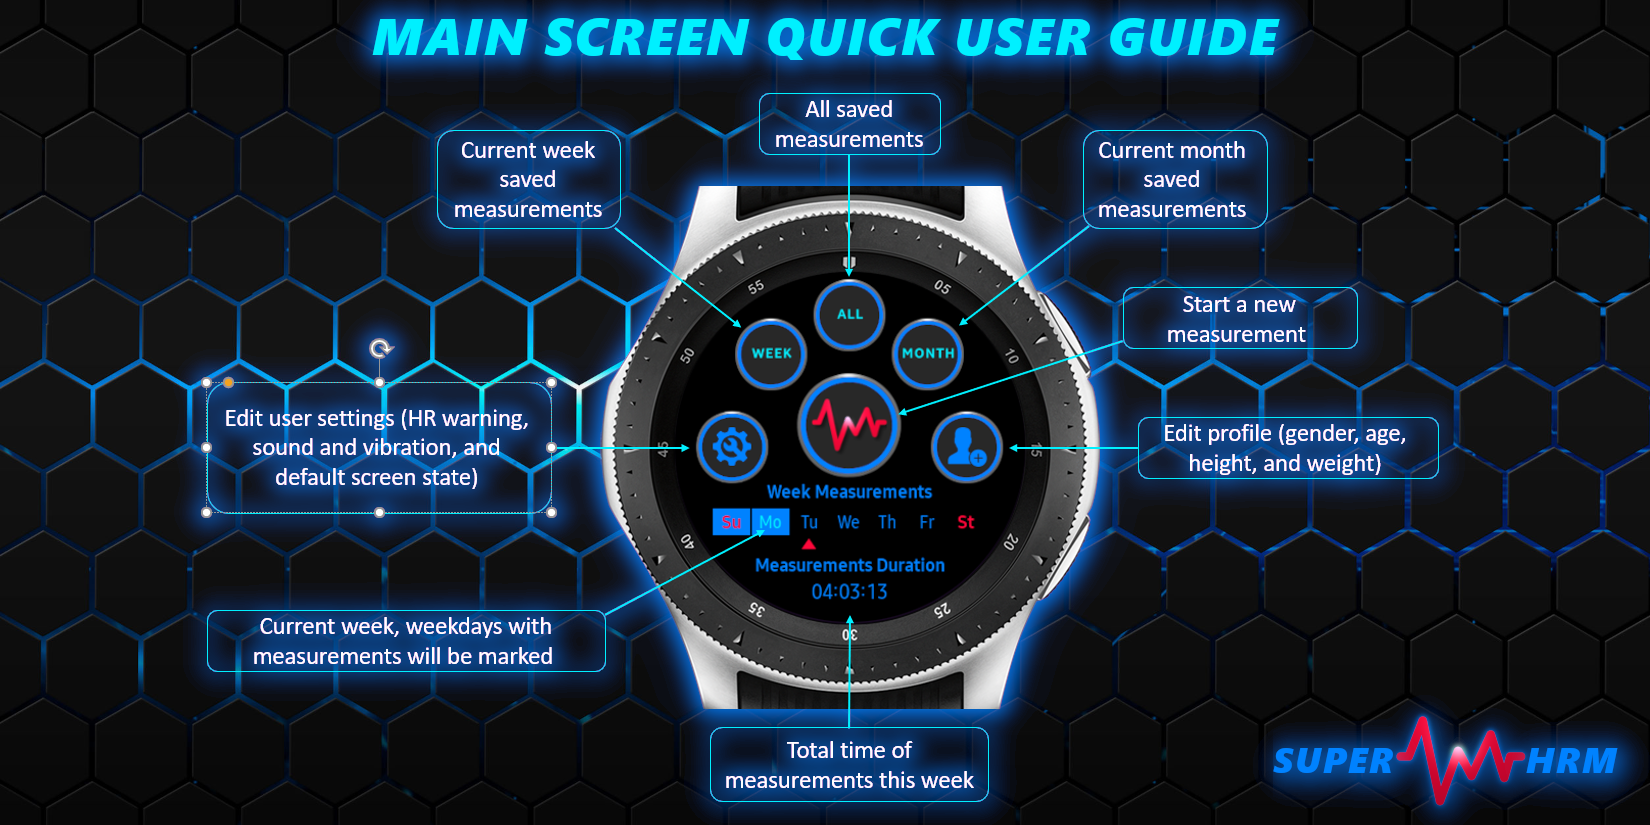
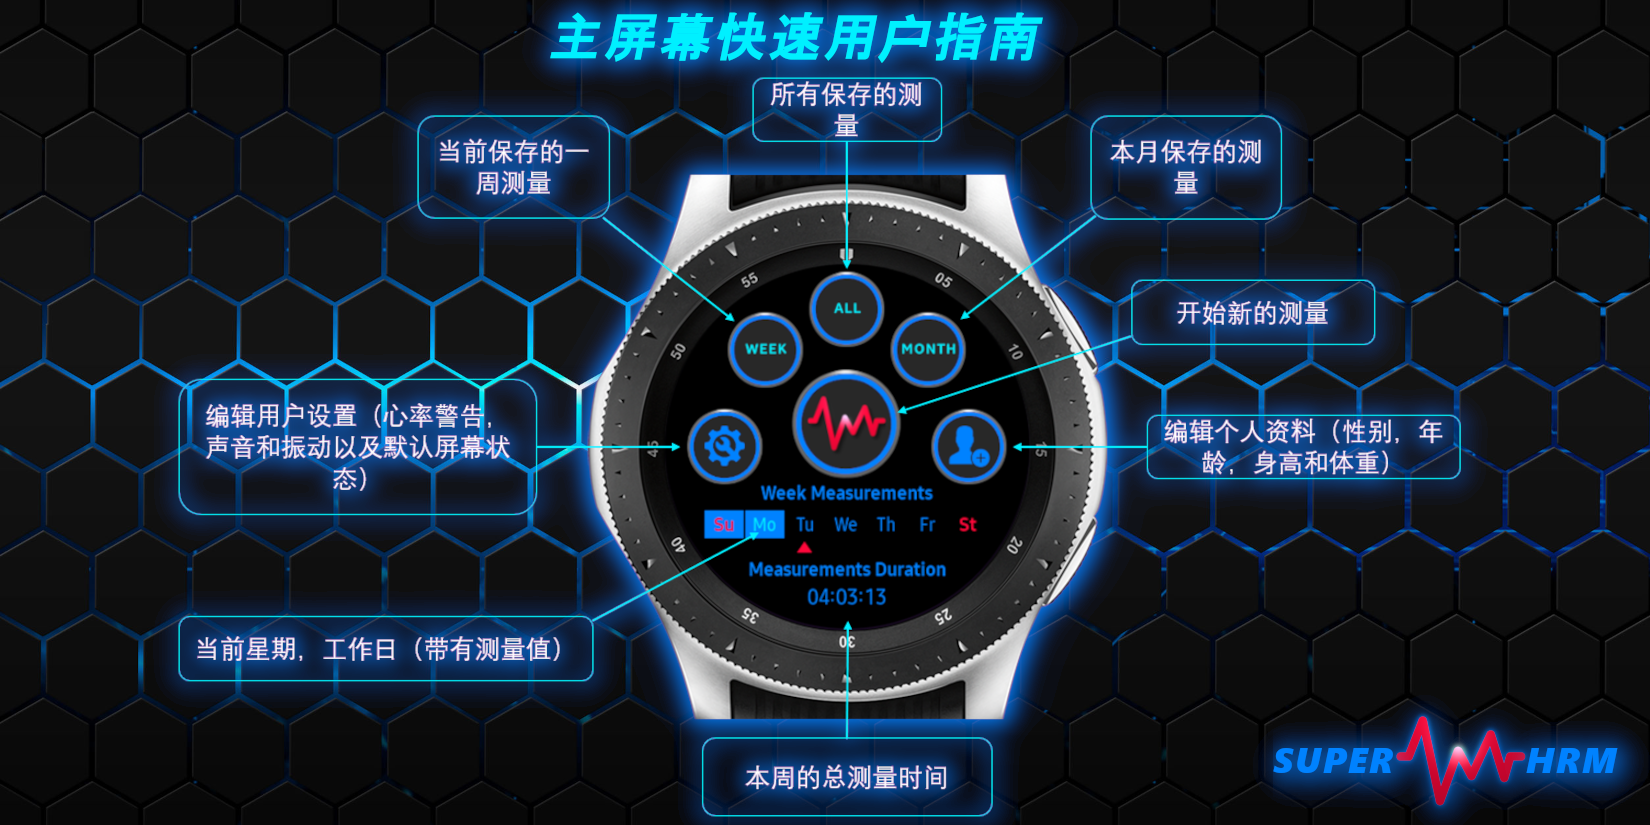
Main Screen
Image A
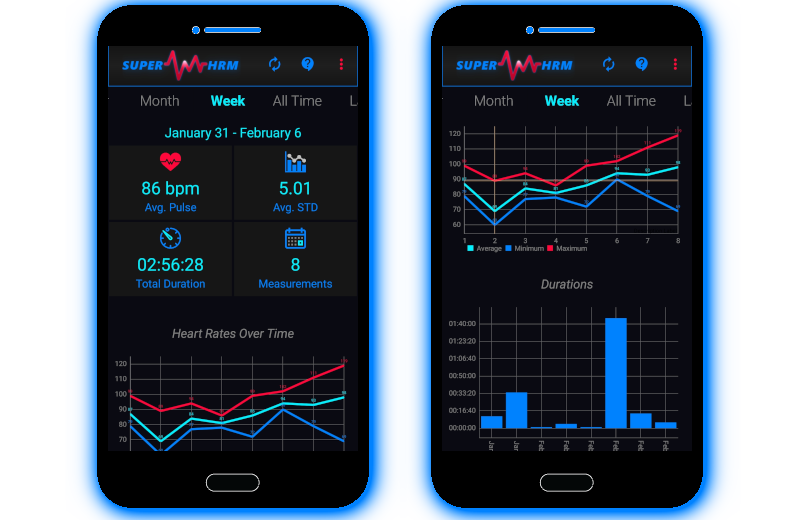
The main screen displays a summary of all the measurements.
This screen can display your summary data in 7 time periods: All measurements, current month measurements, current week measurements, last 7 days, last 30 days and last 365 days.
At the top of the screen [Image A Left], you will find a navigation bar that allows you to move between the periods.
Under the navigation bar, you will find 4 rectangles,
Each rectangle displays a descriptive statistics value of the period:
- The total measurements of the period.
- The total duration of measurements.
- The weighted average (Weighted arithmetic mean) value of the period.
- The weighted average of standard deviation for the period.
The top chart is a line chart that also shows data according to the 7 time periods. The chart displays the distribution of heart rate over time by displaying the minimum, maximum, and average values of all linking measurements of the selected period on the bottom x-axis.
Scroll to the bottom of the screen, and you will find a bar chart that displays the duration of all measurements in the selected period.
Measurements Screen
Image B
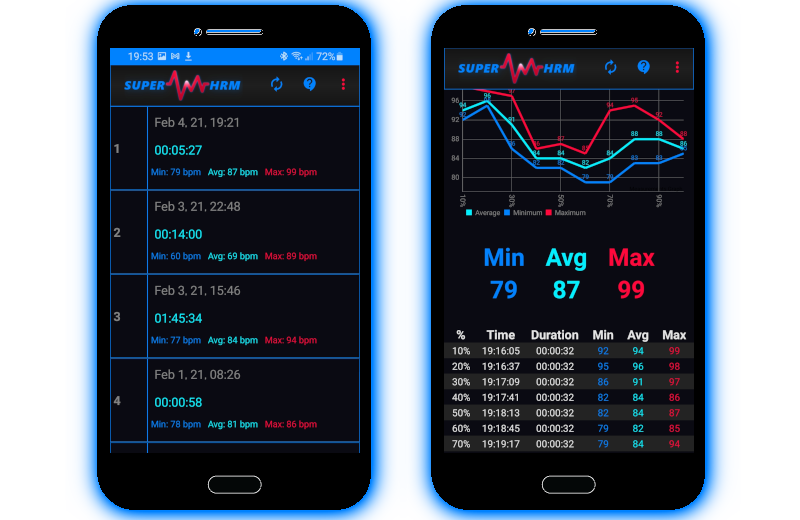
Select "Measurements" from the menu to display the measurements list [Image B Left].
Each item in the list displays a single measurement.
The items are sorted in descending order of the measurements date.
Each item is showing a brief of the measurement.
When selecting an item, a screen that displays the measurement data analysis will be displayed [Image B Right].
Here are the elements of this screen from top to bottom:
1. Measurement date and time.
2. Measurement Duration.
3. Measurement Standard Deviation.
4. A Graph that displays the measurement distribution of heart rate.
5. Measurement table that is parallel to the graph.
The total measurement duration is divided into ten equal segments (10%,20%,30%...100%),
providing you with a comprehensive and easy-to-understand analysis of your heart rate over time.
The ten segments are divided equally from the beginning of the measurement to the current time.
Each one of the ten segments points is plotted with three types of aggregations:
- MAX: the maximum heart rate of all the values in the segment (in red).
- MIN: the minimum heart rate of all the values in the segment (in blue).
- AVG: the average heart rate of all the values in the segment (in cyan greenish-blue).
How to read the summary graphs to learn more.
File List Screen
Image C
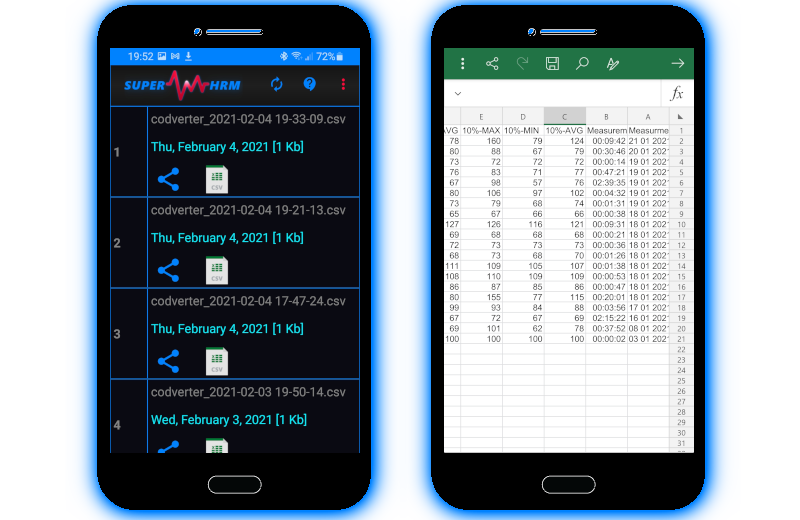
Select 'Files List' from the menu to display all the files.
Each item in the list displays a file that was previously created.
The items are sorted in descending order of the creation date
[Image C Left].
Each item show the creation date, file name, and size of the file.
Use the 'Share' button to send it trough various application the is installed on your phone, including e-mail, whatsup etc...
Use the 'Open' button for opening the file with Microsoft excel.
Each row inside the file [Image C Right] is displaying a measurement session and has a date and time of the measurement,
duration of the measurement, and maximun,minimum and average value of each time segement (10%, 20%...100%).
The last 4 columns are the total maximun, total minimum, total average, and the standard deviation values of the measurement.
中文手册 (Chinese manuals)
对于许多中文用户的要求,这些手册已通过Google翻译翻译成中文-如果母语人士想对翻译进行评论,请与我们联系。
Troubleshooting
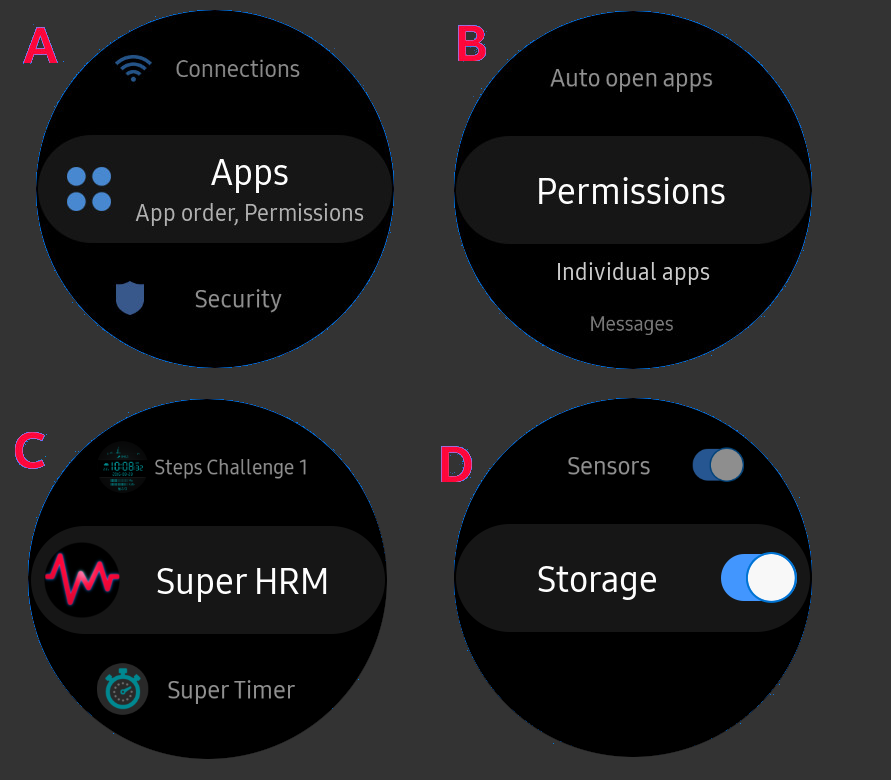
1. Application is not saving your workouts: settings>>Apps>>Permissions>>Super HRM - check the "Storage" checkbox button (if not checked).
News, Software Updates and Bugfix Messages
Version 1.1.8
The update includes:
• Sync all of your data to your Android smartphone, You will need to download the 'Super HRM
Companion' app from google play (it`s free and without annoying ads).
![]()
• Added buttons to delete single measurement log/all measurement logs.
• The save error for some devices was fixed and now all devices are compatible to save data to the filesystem.
• Bugfixes and code improvements.
• Minor UI changes.
Update from: 08-02-2021 19:15:00 GMT+2